Article Overview
The following article describes EasySend’s analytics module. It explains how to navigate to the module and its structure.
Analytics Module Overview
EasySend’s analytics module was designed to empower customers to make better, data-driven business and operational decisions while improving their business outcomes.
Each customer has personalized responsive dashboards that enable them to view different information, such as:
Processes conversion rates
Organization performance evaluation
Revenue analysis
Trends identification
Data in the dashboards is displayed in a wide variety of visualization types that can be adjusted to different filters.
How to Access EasySend Analytics
(See Figure 1 and Figure 2)
To access EasySend Analytics, perform the following steps:
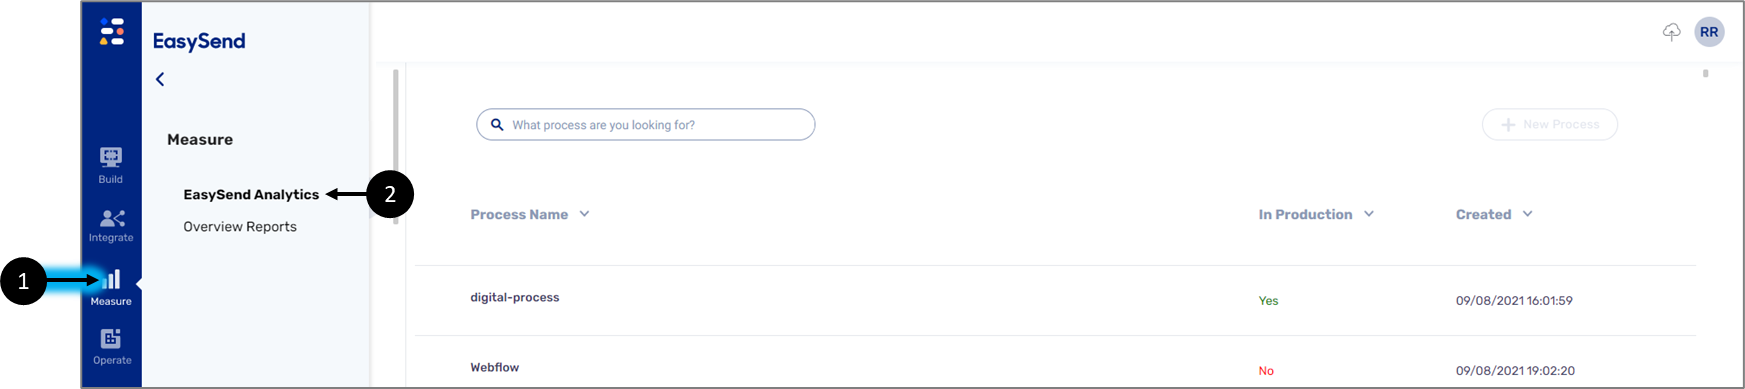
Figure 1: Navigating to EasySend Analytics
Click Measure (1).
Click EasySend Analytics (2).
Result:
The EasySend Analytics screen appears:
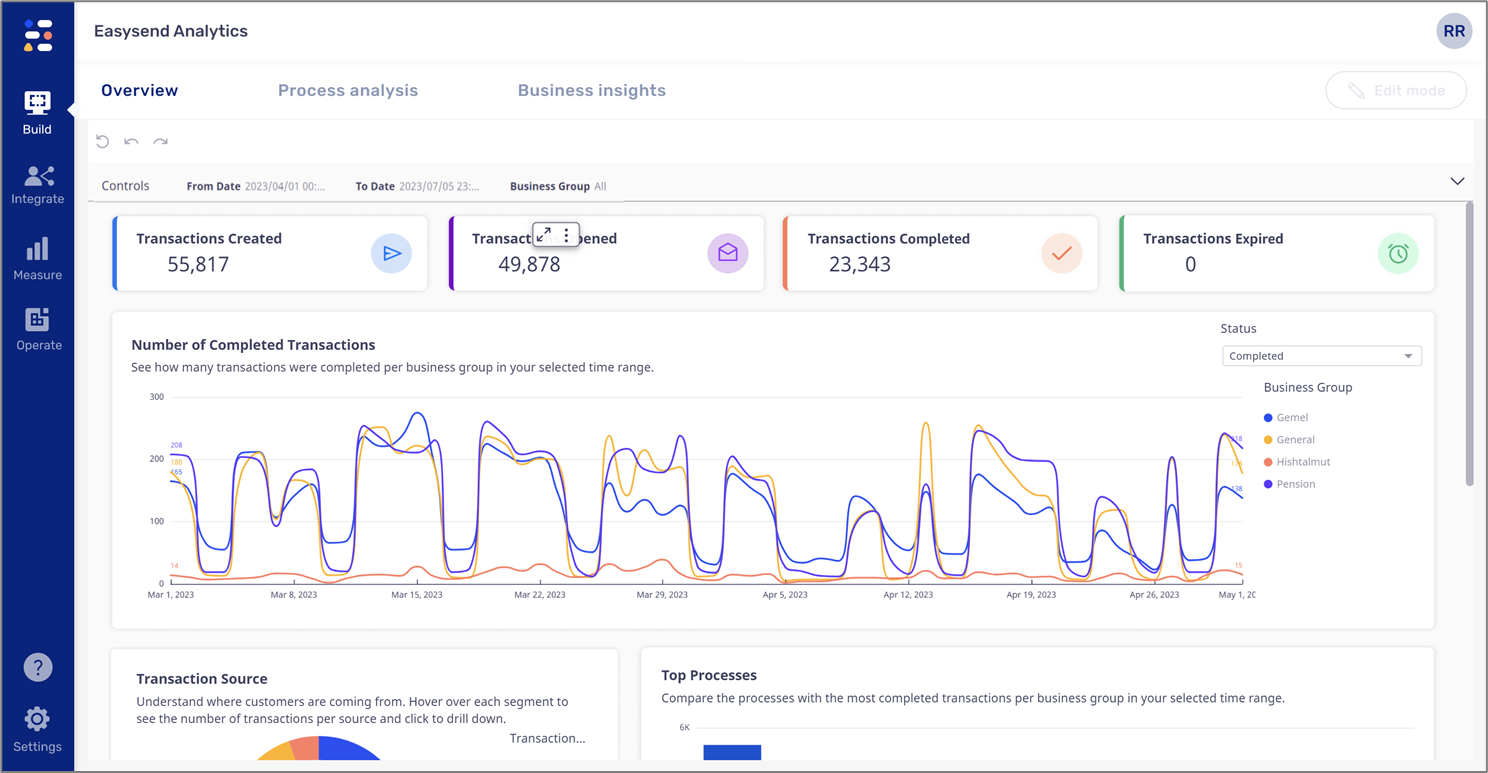
Figure 2: EasySend Analytics
EasySend Analytics Structure
Figure 3 and Table 1 describe the structure of the EasySend Analytics screen.
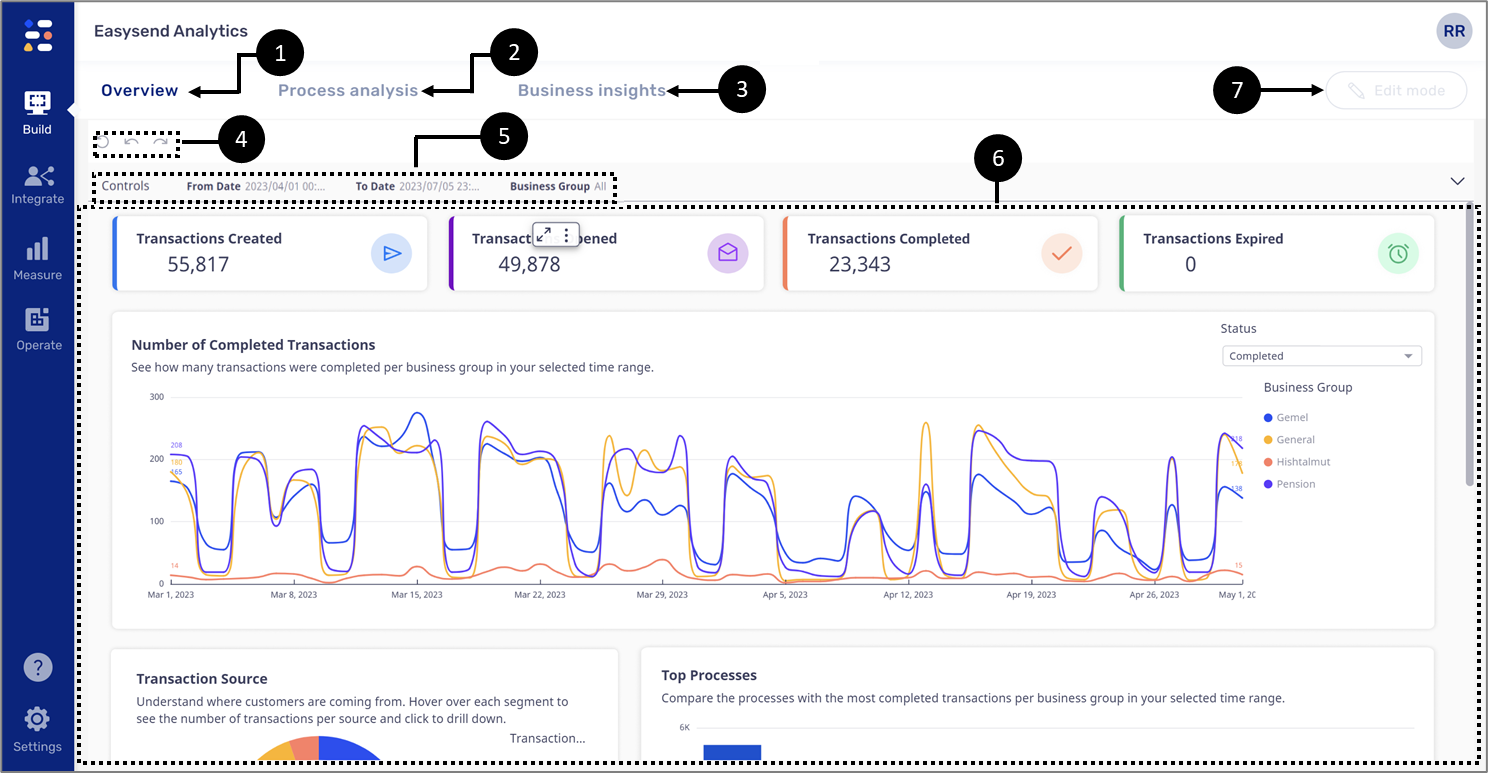
Figure 3: EasySend Analytics Screen
Table 1: EasySend Analytics Screen
Number | Name | Description |
1 | Overview | The default tab displays information about:
|
2 | Process analysis | Displays process analysis information and page visits information |
3 | Business Insights | Displays dashboards that were created by authoring users in your environment |
4 | Rest/Undo/Redo | Enables to:
|
5 | Controls | Enables filtering the displayed information according to the:
|
6 | Display area | Displays information according to the selected tab |
7 | Edit Mode | Enables performing authoring actions |